One of these things is not like the others: COVID needs in St. Louis

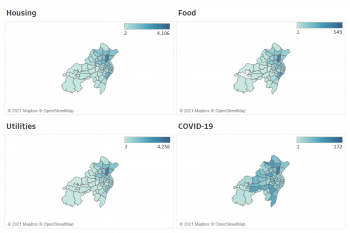
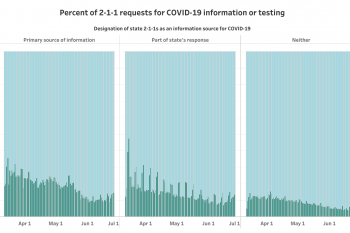
COVID needs are drawing a more diverse set of callers to St. Louis’ top helpline. We mapped 94,661 requests to the 211 helpline for housing, food, utilities, and COVID-19 assistance from 63 ZIP codes in St. Louis City and County between March 12, 2020 and April 28, 2021. The patterns of community need were strikingly […]

COVID requests greatest in CT, IA, MA

When States turn to 211 to provide COVID helpline services, it shows. States partnering with 211s to respond to COVID-19 calls report a larger share of 211 requests are related to COVID-19 information, testing, and vaccination than 211s in other states. We examined 11.2 million phone requests received by 211s in 33 states between March 12, 2020 and April 18, 2021 and compared across states […]

NBC news story creates surge of 211 calls

On January 13th, NBC Nightly News aired a story on how to get a COVID vaccine appointment. In the story, viewers were encouraged to call 211 for help. It worked.

Mental health needs follow COVID trends in TX

In Texas, requests for mental health services rise and fall with COVID-19’s impact. The charts below show nearly identical patterns in the average number of daily requests to 2-1-1s in Texas in 2020 for COVID-19 information and assistance (top chart) and mental health services (bottom chart).

November Needs: Food, COVID-19 requests grew fastest

From October to November, requests to 2-1-1 for food assistance and COVID-19 information increased more than any other needs. Of the 10 needs for which requests increased most during November (blue bars in chart), half were food-related.

Requests for testing surge as COVID-19 cases keep rising

Requests for COVID-19 diagnostic testing are surging as new cases rise. Connecticut 2-1-1 reported 377,558 testing inquiries to its web service in the first 15 days of November, including over 50,000 requests in a single day, November 13th.

Trending in October: COVID, clothes, holiday meals

Requests for holiday meals, COVID-19 services, and clothing grew fastest in October. COVID-19 requests to 2-1-1, which include those seeking information about testing, jumped by 73% in October. Clothing needs grew by 30%. But the biggest October increase was in requests for holiday meals at 153%.

September’s fastest rising needs: Internet access, utility bills

As a new school year began with millions of American children learning remotely at home, requests to 2-1-1s for internet assistance rose 40% in September. Utility payment assistance needs also rose sharply, with requests for heating fuel (+29%), utility payment plans (26%), water (+22%) and gas (+14%) all among the top 10 in percentage increase (see chart, in blue).

PA: COVID requests drop, housing needs surge

Calls about COVID-19 may be dropping, but its economic impact keeps the phones ringing off the hook at Pennsylvania 2-1-1. In contrast to COVID-19 requests, calls to 2-1-1 for rent assistance, shelters, low-cost housing and help dealing with landlord/tenant issues have all steadily increased since the pandemic began.

5 months of COVID-19: What needs are trending?

Americans’ needs for utility payment and rent assistance, low-cost housing and legal assistance all increased in Month 5 of the COVID-19 pandemic.

4-month trends: 2-1-1 requests during COVID-19

Going up: needs for low-cost housing, child care, health services, and COVID-19 requests. Coming down: food and unemployment requests. We examined requests for assistance in 12 need categories reported by 2-1-1s in 32 states since the COVID-19 pandemic began.

Hispanic regions driving rise in COVID calls in Washington

Daily calls about COVID-19 to 2-1-1 in Washington are rising fast, driven largely by areas of the state with large Hispanic populations. With the pandemic entering its fifth month, COVID-19 requests in Washington have shifted dramatically from population centers near Seattle to south central Washington, a region with the largest proportional Hispanic population in the state.

June summary: rent assistance and COVID-19 lead all 2-1-1 requests

Requests to 2-1-1 for rent assistance and COVID-19 information topped all categories in June, while requests for low-cost housing and help buying food increased the most over May. Average daily requests to 2-1-1 for all needs increased slightly (+3%) from May to June, and requests in June remain well-above pre-COVID-19 levels (+28%).

Trends in COVID-19 requests to Connecticut 2-1-1

In Connecticut, requests to 2-1-1 for COVID-19 information are declining as the pandemic wears on while requests for COVID-19 diagnostic testing are rising rapidly. Moreover, most requests for COVID information are received by phone, while an overwhelming majority of requests for diagnostic testing are coming from online searches of 2-1-1’s resource database.

Percent of calls about COVID-19 higher in states relying on 2-1-1

States that are partnering with 2-1-1s in their COVID response are generating more COVID requests to 2-1-1. The charts below show requests for COVID-19 information each day during the pandemic as a proportion of all requests received. In states that partnered with 2-1-1, a larger proportion of requests were COVID-related.

Who calls 211 about COVID? It depends on poverty.

One third of Americans calling 2-1-1 from low-poverty ZIP codes are requesting COVID-19 information about exposure, infection, disease or testing. In sharp contrast, only 11% of 2-1-1 callers from high-poverty ZIP codes want COVID-19 information.