September’s fastest rising needs: Internet access, utility bills

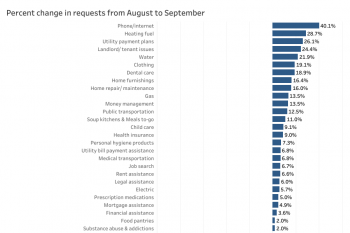
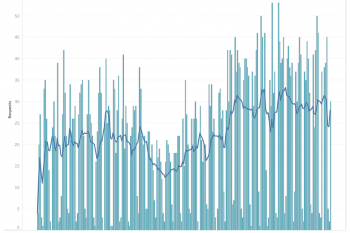
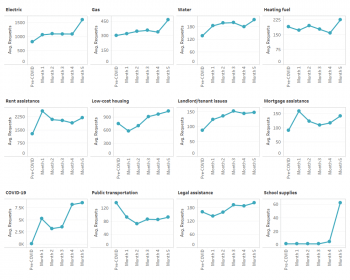
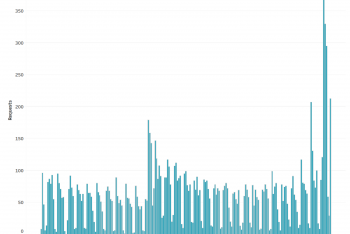
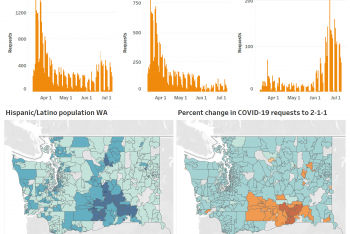
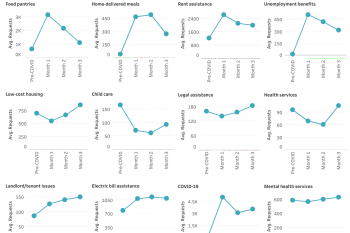
As a new school year began with millions of American children learning remotely at home, requests to 2-1-1s for internet assistance rose 40% in September. Utility payment assistance needs also rose sharply, with requests for heating fuel (+29%), utility payment plans (26%), water (+22%) and gas (+14%) all among the top 10 in percentage increase (see chart, in blue).

Interest in 2-1-1 needs data up 200%

As requests to 2-1-1s have soared during COVID-19, so too has use of 2-1-1 data on community needs. Since the pandemic began, web analytics show there have been nearly one quarter million clicks on 211 Counts.

2-1-1 helping school kids in Philly get internet at home

With Philadelphia public schools online through at least November 17, assuring internet access for all was essential. The City and School District of Philadelphia launched PHLConnectED, part of a $17 million digital equity plan, to provide free access to 35,000 student households.

CARES = calls at 2-1-1 in Ohio

When Summit County, Ohio turned to 2-1-1 to help deliver COVID-19 relief, the demand was clear instantly. Summit County CARES, a program to help families affected by the economic fallout of the COVID-19 pandemic pay their rent and utility bills, launched on July 6th.

California fires drive 2-1-1 to near-record usage

California wildfires pushed 2-1-1 call volume back near peak levels set in the first month of the COVID-19 pandemic. A closer look at 2-1-1 requests during the CZU fire showed a dramatic increase in disaster-related calls seeking assistance with housing and shelter.

PA: COVID requests drop, housing needs surge

Calls about COVID-19 may be dropping, but its economic impact keeps the phones ringing off the hook at Pennsylvania 2-1-1. In contrast to COVID-19 requests, calls to 2-1-1 for rent assistance, shelters, low-cost housing and help dealing with landlord/tenant issues have all steadily increased since the pandemic began.

Jefferson, Boone counties lead August surge in 2-1-1 requests

COVID-19 cases aren’t the only thing rising in Jefferson and Boone Counties in Missouri. So are requests to the 2-1-1 helpline, which links callers with food, housing and utility assistance, as well as help with other needs.

August requests grew fastest in less populous counties

Although urban centers generate the lion’s share of 2-1-1 requests, calls from less populous counties are increasing faster. From July to August, requests to 2-1-1 from metropolitan counties increased by 6%. During same time period, requests to 2-1-1 from micropolitan counties increased by 9.2% and other, more rural and less populous counties increased by 9.4%.

Iowa, Minnesota see biggest jumps July-to-August

Wind storms and back-to-school needs pushed 2-1-1 requests higher in America’s heartland last month. Examining 27 states in a daily tracking system, Minnesota (+24%) and Iowa (+23%) saw the largest July-to-August increases in requests.

A summer of mortgage payment shortfalls

Requests for mortgage payment assistance rose throughout the summer of 2020. We compared requests received by 2-1-1s during the first eight months of 2020 (orange line on the chart) with the same dates in 2019 (blue line). In 2020, requests spiked as the COVID-19 pandemic began in March. At its peak, 2020 rates were over four-fold higher than the same date in 2019.

More callers seeking help paying medical bills

After avoiding trips to the doctor in the early months of the COVID-19 pandemic, health care visits have increased and so have requests for help paying for medical expenses. Medical expense assistance requests declined in the first two months of the pandemic, but since then they have risen nearly 60 percent and are now well above pre-COVID levels.

2-1-1s reach populations vulnerable to COVID-19

When you compare 2-1-1 callers in the U.S. to populations that the U.S. government has designated as health priorities, it is abundantly clear that 2-1-1s serve virtually every single group. These data provide more evidence for why 2-1-1s should be at the heart of public health efforts to address COVID-19.

Are 2-1-1s with bigger COVID-19 roles expanding their base?

2-1-1s serving as the primary COVID-19 helpline in their service area appear to be reaching a broader cross-section of Americans. One explanation is that by virtue of their increased visibility in responding to COVID-19, 2-1-1s in the former group are reaching a more diverse group of callers, who are – in every poverty-level category – more likely to be seeking COVID-19 information.

5 months of COVID-19: What needs are trending?

Americans’ needs for utility payment and rent assistance, low-cost housing and legal assistance all increased in Month 5 of the COVID-19 pandemic.

2-1-1 requests now exceed total for all of 2019

Last Friday afternoon, somewhere in the U.S., a caller made the 5,306,109th request to 2-1-1 in 2020.  And with that call, the total number of requests received by 2-1-1s in the U.S. surpassed the total number of requests received in all of 2019, with 156 days still remaining in the year. 

Trends of top 3 food needs during COVID

The impact of COVID-19 on food needs of Americans has been profound but has varied by type of need. Requests to 2-1-1s for food pantries and home-delivered meals both saw dramatic increases in the earliest phases of the pandemic. However, food pantry requests began declining almost immediately, while requests for home-delivered meals remained at their peak level for nearly two months before declining.  In contrast to both, requests for help buying food  – which are primarily applications to SNAP – rose sharply and have remained largely steady at elevated levels.

Mental health contrasts: comparing NC, SD, MI

How has the COVID-19 pandemic affected needs for mental health services? We examined 13,219 requests to 2-1-1 for mental health services, mental health facilities, and other mental health needs between January 1 and July 27, 2020, in North Carolina, South Dakota, and Michigan.

2-1-1 callers voting no on back-to-school?

Will it be back-to-school or school-at-home during COVID-19? Data from 2-1-1 helplines suggest many parents have already chosen.  One of the most reliable patterns in all 2-1-1 data is that requests for clothing spike each year in July and August as families seek back-to-school clothing for growing kids.  But this year, not so much. 

COVID deaths + funeral costs = more burial assistance needs

Early in the pandemic, requests to 2-1-1 for help paying for burial and funeral costs rose in states with high COVID-19 death rates. The combination of high COVID-deaths and high funeral costs in a state appear linked to requests to 2-1-1 for help with death-related expenses.

Utility requests surge in NC ahead of expiring moratorium

As state protections expire, calls to 2-1-1 for utility payment assistance are surging in North Carolina. With a state moratorium on utility disconnections set to end on July 29th, 2-1-1 has seen a sharp increase in calls for help during the last week.

Wave Two hits 2-1-1s

As COVID-19 cases have surged across the U.S., so too have calls for help to 2-1-1. In prior reporting, we identified distinct phases of 2-1-1’s pandemic response by the volume of requests. We refer to the fifth phase as Wave Two of 2-1-1 requests during COVID-19, and note its close correspondence in time to the rise in COVID-19 cases.

4-month trends: 2-1-1 requests during COVID-19

Going up: needs for low-cost housing, child care, health services, and COVID-19 requests. Coming down: food and unemployment requests. We examined requests for assistance in 12 need categories reported by 2-1-1s in 32 states since the COVID-19 pandemic began.

3.5 million. Twice.

Two pandemic milestones intersected this week at counts of 3.5 million. On July 15, confirmed cases of COVID-19 in the U.S. reached 3.5 million. Five days later, requests to 2-1-1 helplines during the pandemic hit the same number.

Mental health requests in Ohio vary by age and sex during COVID

How do men and women differ in their mental health requests to 2-1-1 during the COVID-19 pandemic, and do differences vary further by age? To explore these questions in a preliminary way, we analyzed 768 mental health requests to 2-1-1 from five counties in Ohio.

Finding food in Florida: Needs vary by region

Food needs in Florida are high since COVID-19, but vary by region with rates of food pantry requests highest in the panhandle, SNAP requests highest around Orlando, and home-delivered meal requests highest on the southeastern coast.

Hispanic regions driving rise in COVID calls in Washington

Daily calls about COVID-19 to 2-1-1 in Washington are rising fast, driven largely by areas of the state with large Hispanic populations. With the pandemic entering its fifth month, COVID-19 requests in Washington have shifted dramatically from population centers near Seattle to south central Washington, a region with the largest proportional Hispanic population in the state.

June summary: rent assistance and COVID-19 lead all 2-1-1 requests

Requests to 2-1-1 for rent assistance and COVID-19 information topped all categories in June, while requests for low-cost housing and help buying food increased the most over May. Average daily requests to 2-1-1 for all needs increased slightly (+3%) from May to June, and requests in June remain well-above pre-COVID-19 levels (+28%).

2-1-1 rent requests rise with Milwaukee eviction filings

Eviction filings fell to near zero in Milwaukee during its temporary eviction ban in the early months of COVID-19. However, as the ban grew closer to expiring, rent assistance requests to 2-1-1 more than tripled.

Trends in COVID-19 requests to Connecticut 2-1-1

In Connecticut, requests to 2-1-1 for COVID-19 information are declining as the pandemic wears on while requests for COVID-19 diagnostic testing are rising rapidly. Moreover, most requests for COVID information are received by phone, while an overwhelming majority of requests for diagnostic testing are coming from online searches of 2-1-1’s resource database.

Percent of calls about COVID-19 higher in states relying on 2-1-1

States that are partnering with 2-1-1s in their COVID response are generating more COVID requests to 2-1-1. The charts below show requests for COVID-19 information each day during the pandemic as a proportion of all requests received. In states that partnered with 2-1-1, a larger proportion of requests were COVID-related.

Housing needs rise as Wisconsin eviction ban lifted

Housing requests to 211 Wisconsin for rent assistance and help finding shelters are rising after a temporary ban on evictions and foreclosures ended. We analyzed 23,802 requests for rent assistance and shelters made to 211 Wisconsin before, during and after the temporary ban.

After 2-month decline, medical transportation needs rising

Requests to 2-1-1s for health services and medical transportation are rising in tandem. Before COVID-19 was declared a pandemic, requests for medical transportation averaged between 80 and 100 requests a day. By April, they had declined to less than 40 requests per day, as in-person health care visits dropped. Requests to 2-1-1s for medical transportation are increasing again, and now average over 60 requests per day.

Tax time… in July?

2020 looked like any other year for 2-1-1s helping link callers to tax preparation assistance. Until COVID-19, that is. Less than a week after COVID-19 was declared a pandemic, the Federal Government extended the deadline for filing tax returns until July 15, 2020. As the chart shows, the effect of the federal extension is clear. […]

12 trends from the first 3 months of COVID-19

Three months into the COVID-19 pandemic, requests to 2-1-1s in the U.S. are trending up for child care, low-cost housing, landlord-tenant issues, legal assistance, health services and mental health services.

A new normal for 2-1-1 food requests?

Three months into the COVID-19 pandemic, food requests to 2-1-1s in the U.S. seem to be stabilizing. The new rate is more than double what it was pre-COVID.

Big differences in COVID needs for high and low poverty neighborhoods

Since COVID-19, people in high-poverty neighborhoods are more likely to call 2-1-1 seeking help with food and housing while those from low-poverty neighborhoods are more likely to call about healthcare, which includes information about COVID risks, protections, symptoms and testing.

One pandemic, five distinct periods (so far)

As the COVID-19 pandemic approaches the 3-month mark, we can identify four distinct periods in the volume of requests to 2-1-1 it has generated. A fifth period is now beginning, and early signs indicate it may bring a new twist.

Phone vs. web requests to 2-1-1 during COVID

Requests to 2-1-1 can come by phone or through web searches, and new analyses suggest needs differ by modality. During COVID-19, a much larger proportion of web searches are seeking help with food, while phone requests are more likely to focus on housing, healthcare and mental health needs.

Food needs in low-poverty ZIPs trending up?

In an earlier report, we noticed that food requests to 2-1-1s from low-poverty ZIP codes had larger percentage increases from pre- to post-COVID than ZIP codes with higher poverty rates. Eight weeks later, the same pattern seems to be holding.

COVID trends for top 3 housing needs

When Americans call 2-1-1 with housing-related needs, 80-90% of all requests are for rent assistance, shelters, or low-cost housing. However, the trends for each in 2-1-1 requests since COVID-19 differ, and only low-income housing requests are still rising 12 weeks after the pandemic began.

Tourist towns hurt by COVID

COVID-19 has been economically devastating to the leisure and hospitality industries and many people who work in them. Popular tourist destinations such as Las Vegas, NV, Atlantic City, NJ and Myrtle Beach, SC have seen dramatic increases in 2-1-1 calls since COVID-19 was declared a pandemic.

Rent needs higher since COVID in cities with more service workers

Rent assistance requests to 2-1-1 helplines since COVID are higher in cities with a larger proportion of workers in personal care and service occupations. As the percent of the workforce in personal care and service jobs increases, so too does the rate of requests for help paying rent.

Childcare needs rise as states reopen

Requests for childcare assistance are on the rise at 2-1-1 helplines. The steady increase in requests for childcare during May coincides with states reopening after COVID-related shutdowns.