Mental health needs follow COVID trends in TX
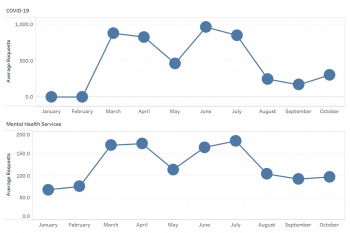
In Texas, requests for mental health services rise and fall with COVID-19’s impact. The charts below show nearly identical patterns in the average number of daily requests to 2-1-1s in Texas in 2020 for COVID-19 information and assistance (top chart) and mental health services (bottom chart).

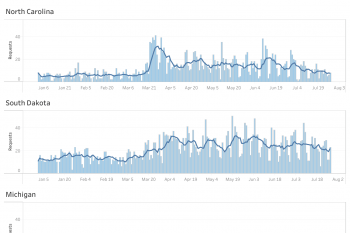
Mental health contrasts: comparing NC, SD, MI

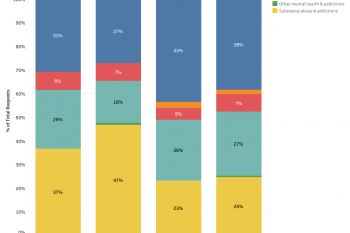
How has the COVID-19 pandemic affected needs for mental health services? We examined 13,219 requests to 2-1-1 for mental health services, mental health facilities, and other mental health needs between January 1 and July 27, 2020, in North Carolina, South Dakota, and Michigan.

Mental health requests in Ohio vary by age and sex during COVID

How do men and women differ in their mental health requests to 2-1-1 during the COVID-19 pandemic, and do differences vary further by age? To explore these questions in a preliminary way, we analyzed 768 mental health requests to 2-1-1 from five counties in Ohio.

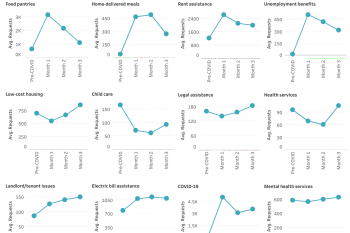
12 trends from the first 3 months of COVID-19

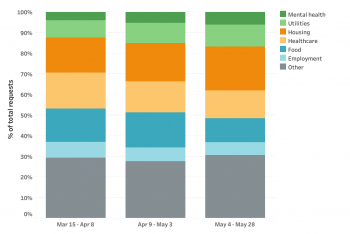
Three months into the COVID-19 pandemic, requests to 2-1-1s in the U.S. are trending up for child care, low-cost housing, landlord-tenant issues, legal assistance, health services and mental health services.

Big differences in COVID needs for high and low poverty neighborhoods

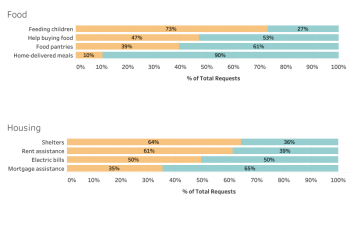
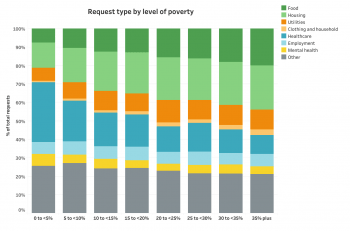
Since COVID-19, people in high-poverty neighborhoods are more likely to call 2-1-1 seeking help with food and housing while those from low-poverty neighborhoods are more likely to call about healthcare, which includes information about COVID risks, protections, symptoms and testing.

Phone vs. web requests to 2-1-1 during COVID

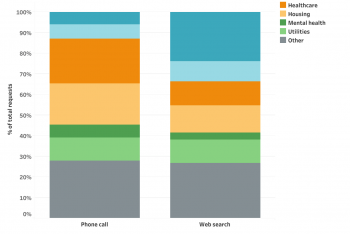
Requests to 2-1-1 can come by phone or through web searches, and new analyses suggest needs differ by modality. During COVID-19, a much larger proportion of web searches are seeking help with food, while phone requests are more likely to focus on housing, healthcare and mental health needs.